Sales development as a function, role, and profession has seen serious change lately. In recent years, we’ve had a significant rise in stature, a host of new SDR-focused technologies, and even a conference all its own.
One constant is a thirst for the metrics behind the sales development function. To make sense of the changes and trends, we researched and collected insights from 355 B2B companies. Our 2016 Sales Development Metrics and Compensation report is available today, and we have a ton to share with you.
What’s inside the report
This is our sixth round of sales development research since 2007 covering:
- Reporting structure
- Models, territories, and SDR to AE ratios
- Experience, ramp, and tenure
- Compensation, quota, and career path
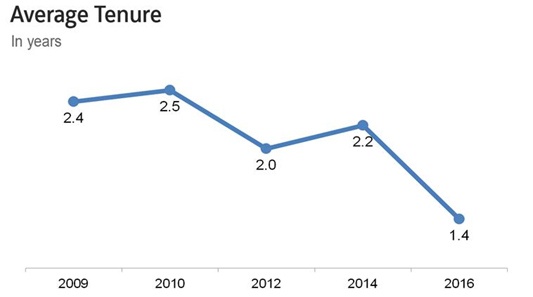
One data point that jumped out to me was how sharply average SDR tenure has dropped. From 2.2 years in 2014, it has fallen to all-time low of 1.4 years.

We discuss the impact of tenure and ramp time on productivity in the report.
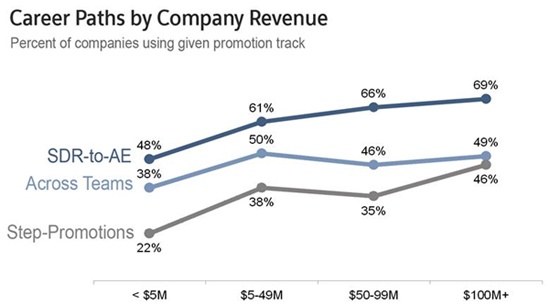
Another data point that stood out was the percentage of companies deploying specific types of career paths (and how that changes as companies grow).

Promotion tracks are defined and discussed in the report.
What’s new is this year’s report
In prior years, readers would ask us whether “world-class” Sales Development teams are more or less likely to do X, use Y technology, or to track metric Z. We were challenged in defining exactly what world-class means.
- How do you compare an inbound SMB group with an outbound enterprise group?
- Does passing more qualified opportunities always mean the team is higher performing? What if their ASP is 50% below the median?
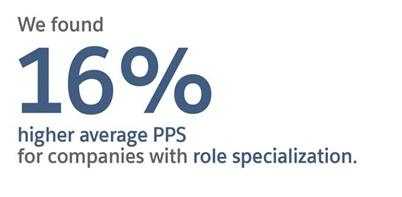
This year we took a stab at scoring effectiveness. Please meet the Pipeline Power Score (PPS). Scaled from 1-100, the PPS compares the effectiveness of sales development groups against one another. PPS allows us to answer questions like: Is specialization associated with a higher Pipeline Power Score?
Turns out, the answer is yes.

Of course, there’s a lot more in the report that can be summarized in the short paragraphs above. Make sure to download your copy of the 2016 Sales Development Metrics report.
Note: If you are that rare exec who enjoys math, you can learn more about how we calculated PPS below.
More on PPS
As a first step, we held a roundtable of SDR leaders and asked them which factors they take into account when gauging the effectiveness of sales development groups. Many factors were outside the scope of our research and/or too hard to quantify. After much back and forth the group agreed on:
- Number of opportunities accepted by sales
- Average selling price
- Inbound versus blended versus outbound focus
- Percentage of reps in group at/above quota
Next, we turned to the data. We eliminated responses from our dataset that didn’t contain all four data points. We then converted the raw scores into z-scores for each of the metrics. We summed the z-scores to generate a composite score. We debated the merits of under/over weighting the factors, but in an attempt to minimize bias, we ultimately elected to evenly weigh the z-scores.
Finally, we calculated percentile ranks from our composite score and, voila, the Pipeline Power Score was born.

