In the Sales Development world, metrics can be finicky beasts.
What works at Google, LogMeIn, or Okta might not be transferable from one to the other, let alone work for you. Questions around how can I benchmark my team make leading an SDR group all the more challenging. In our 2018 SDR Metrics & Compensation Report, we analyze the biggest shifts in recent years and provide core metrics to measure these groups. We also break out findings by company revenues, ASP, and other factors.
About the Participants
This is our seventh round of this research project and I can tell you it's our best dataset yet. This year, 434 Executives from a broad range of B2B companies participated. (89% with HQs in North America, median respondent revenues of $24M, and median ASP at $28K).

New in This Year’s Report
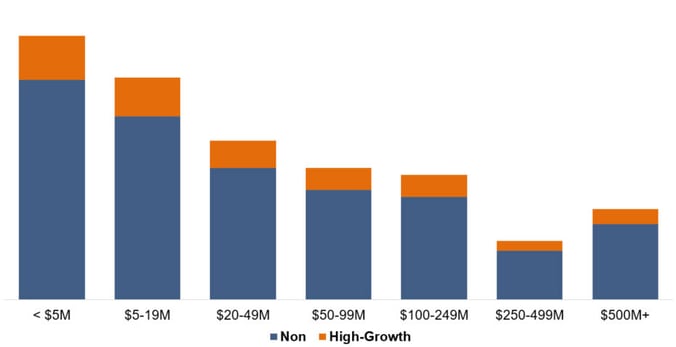
Each time we’ve published this research, readers have asked how model, metrics, compensation, tech stack, etc. differ between high-growth companies and the rest of the pack.
But what exactly makes a company “high-growth”? If Company A did $2M in 2017 and projects $6M in 2018, that additional $4M represents 200% growth. Compare that to Company B who will do $290M in 2018 up from $200M in 2017, that’s “only” 45% growth—but an additional $90M in revenue.
Clearly, raw growth percentage doesn’t tell the whole story.
We decided to take an approach that separates that fastest growing companies by revenue band. Using revenues and growth rate, we marked the top quintile (top 20%) per band as “high-growth.” Throughout the report we called out comparisons between “high-growth” and non companies.

Download the full report
The report provides a comprehensive look at the data, trends, and metrics driving sales development in 2018. We couldn't do these types of research without this community. So thank you.
Get your copy of our 2018 SDR Metrics & Compensation Report. And let us know if you have any comments, questions, or improvements for the next round.
