In the SaaS world, metrics can be finicky beasts. What works at LinkedIn, Salesforce, Twilio, or Zendesk might not be transferable from one to the other, let alone work for you.
 Questions around how can I benchmark myself make leading an AE group all the more challenging. In our 2017 SaaS AE Metrics & Compensation Report, we analyze the biggest shifts in recent years and provide core metrics to measure AE teams. We also break findings down by company revenue, ACV, and other factors.
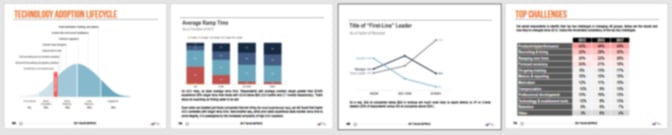
This is our sixth round of this research project and I can honestly say it's our best release yet. The report is organized into five sections:
- Group Structure
- Ramp and Retention
- Quota and Compensation
- Activity and Technologies
- AE Leadership
384 Executives from a broad diversity of SaaS companies participated. 89% were headquartered in North America. Median respondent revenue was $27M and median respondent ACV was $25K.

Download the 2017 SaaS AE Report
We wrote this report to provide a comprehensive look at the data, trends, and key metrics for leading an AE team in 2017. We couldn't do these types of research without this community. So thank you.
Arm yourself and your company with the latest SaaS knowledge and get the full report.