Last quarter is in the books. How did your team do?
If you're like most companies, you know a) your team's actual vs. goal and b) the number of reps at/above quota. But does that truly give a full picture of performance?
Sales Team Grader
I've been working on a benchmarking tool to fill in the gaps. (Big thanks to the folks who participated in beta testing!) The tool benchmarks your team against:
- Group performance vs. goal
- % of reps at 90%+ (of quota)
- Median rep performance
- Top and bottom 20%
By way of example, I ran analyses on two companies. Here are the results.
COMPANY A
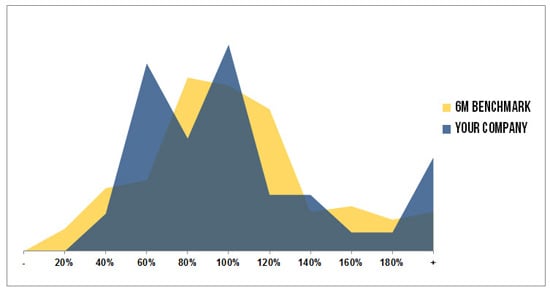
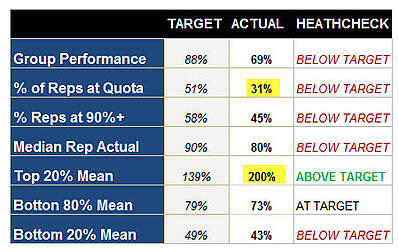
Group Performance: 69% Percentage of Reps at Quota: 31%


Two things jump out at me:
- The top 20% of reps are killing it. They are far exceeding the benchmark.
- At this point in the year, we'd expect roughly 50% off reps to be at quota. Company A is trailing that mark significantly.
- Are territories equitable?
- Are goals (excessively) stretch?
- What would happen if 1 or 2 of the top reps were to leave?
- Are B-players receiving the coaching they need?
COMPANY B
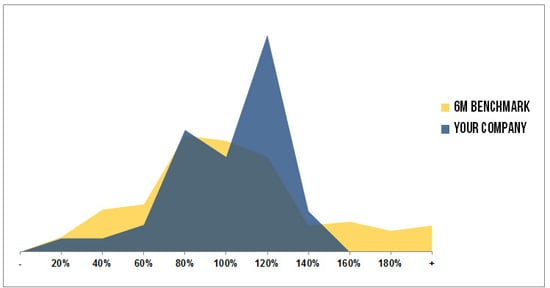
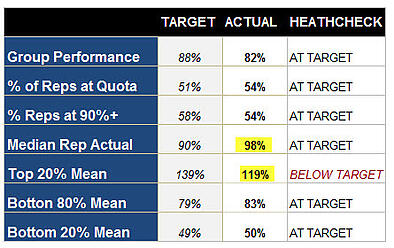
Group Performance: 82% Percentage of Reps at Quota: 51%


This group fits the benchmark to a T. Two things jump out at me here:
- The median rep is nearly at quota. That is a bit unusual at this point in the year.
- The top 20% aren't overachieving as much as we'd expect. Look at how performance tails off.
- Why aren't the A-players crushing it?
- Are they sandbagging month-to-month?
- Are commissions capped?
- Should accelerators be paid for over-achieving?
Now it’s your turn
It takes five minute to grade your sales team. Don’t you want to know where stand?
I hope this tool will allow you to see your group's performance with fresh eyes. I'm here to help, so feel free to reach out.
----------------

About Matt Bertuzzi
Matt writes about inside sales metrics & trends. He is co-author of The Outbound Index.
Connect on Twitter and Google+.

